题目内容
(请给出正确答案)
[单选题]

A.90 MB
B. 272 MB
C. 362 MB
D. 1,440 MB
 如搜索结果不匹配,请 联系老师 获取答案
 更多“View the Exhibit to examine th…”相关的问题
第1题
A.120M
B.320M
C.480M
D.600M
第2题
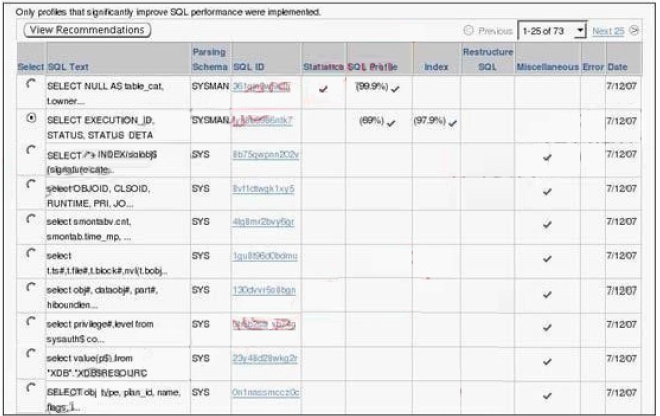
A. Accept the recommended SQL profile.
B.Collect statistics for the related objects.
C. Run the Access Advisor for the SQL statement.
D. Run the Segment Advisor for recommendations.
第4题

A. The optimizer uses a new plan because none of the plans in the exhibit2 are fixed plans.
B. The optimizer uses the plan in the second row of the exhibit2 because it is an accepted plan.
C. The optimizer uses the plan in the first row of the exhibit2 because it is the latest generated plan.
D. The optimizer uses the plan in the first row of the exhibit2 because OPTIMIZER_MODE was set to FIRST_ROW during its creation.
第5题


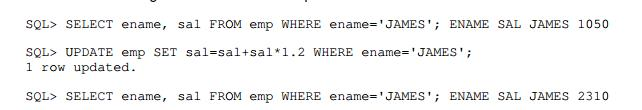
A. All dependent objects remain valid.
B. Only the procedure and function become invalid and must be recompiled.
C. Only the view becomes invalid and gets automatically revalidated the next time it is used.
D. Only the procedure and function become invalid and get automatically revalidated the next time they are called.
第6题
A. Flashback logging is not enabled for the database.
B. The changes made to the table are not committed.
C. Supplemental logging is not enabled for the database.
D. The database is not configured in ARCHIVELOG mode.
第7题

A. because AWR baseline is not enabled
B. because Current Open Cursors Count is not a basic metric
C. because the STATISTICS_LEVEL parameter is set to BASIC
D. because the AWR baseline is a system-defined moving window baseline
第8题

A. Another repair session is running concurrently.
B. The failure ID has not been mentioned in the command for data file 5.
C. There are new failures recorded in the Automatic Diagnostic Repository (ADR).
D. The ADVISE FAILURE command has not been issued before the REPAIR FAILURE command.
第9题
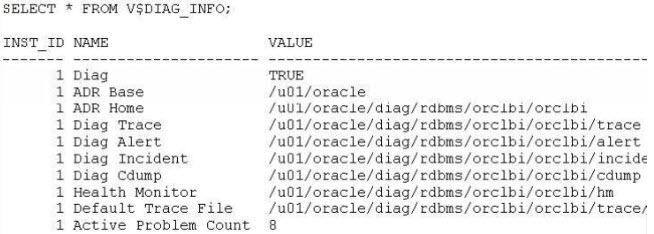
A. The text alert log file will be available in Diag Trace
B. A copy alert log file will be kept in Diag Incident for every incident.
C. The XML version of the alert log file will be available in Diag Trace.
D. An Automatic Database Diagnostic Management (ADDM) report is generated and stored in the Health Monitor whenever an incident occurs.
第10题

A. 1 - Oracle Loader, 2 - Oracle Data Pump, 3 - Direct Path API
B. 1 - Oracle Data Pump, 2 - Direct Path API, 3 - Oracle Loader
C. 1 - Direct Path API, 2 - Oracle Loader, 3 - Oracle Data Pump
D. 1 - Oracle Loader, 2 - Direct Path API, 3 - Oracle Data Pump


为了保护您的账号安全,请在“赏学吧”公众号进行验证,点击“官网服务”-“账号验证”后输入验证码“”完成验证,验证成功后方可继续查看答案!

 微信搜一搜
微信搜一搜
 赏学吧
微信搜一搜
赏学吧
赏学吧
微信搜一搜
赏学吧