题目内容
(请给出正确答案)
[主观题]
&8226;The graph below shows the profit or loss made on three new products (A, B and C) in
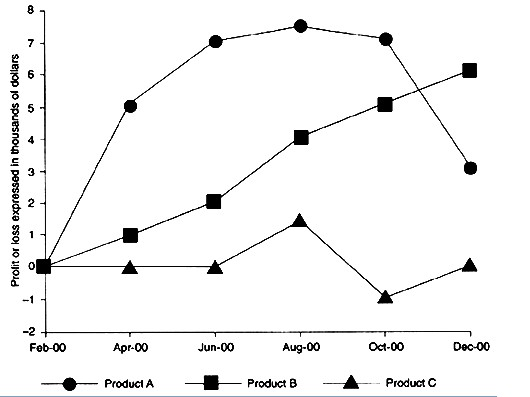
&8226;The graph below shows the profit or loss made on three new products (A, B and C) in the year following their introduction to the market.
&8226;Using the information from the graph, write a short report on changes that occurred between February 2000 and the end of the year.
&8226;Write 120-140 words on a separate sheet.
 如搜索结果不匹配,请 联系老师 获取答案